Solar Panel Output Australia by City — kWh by Location
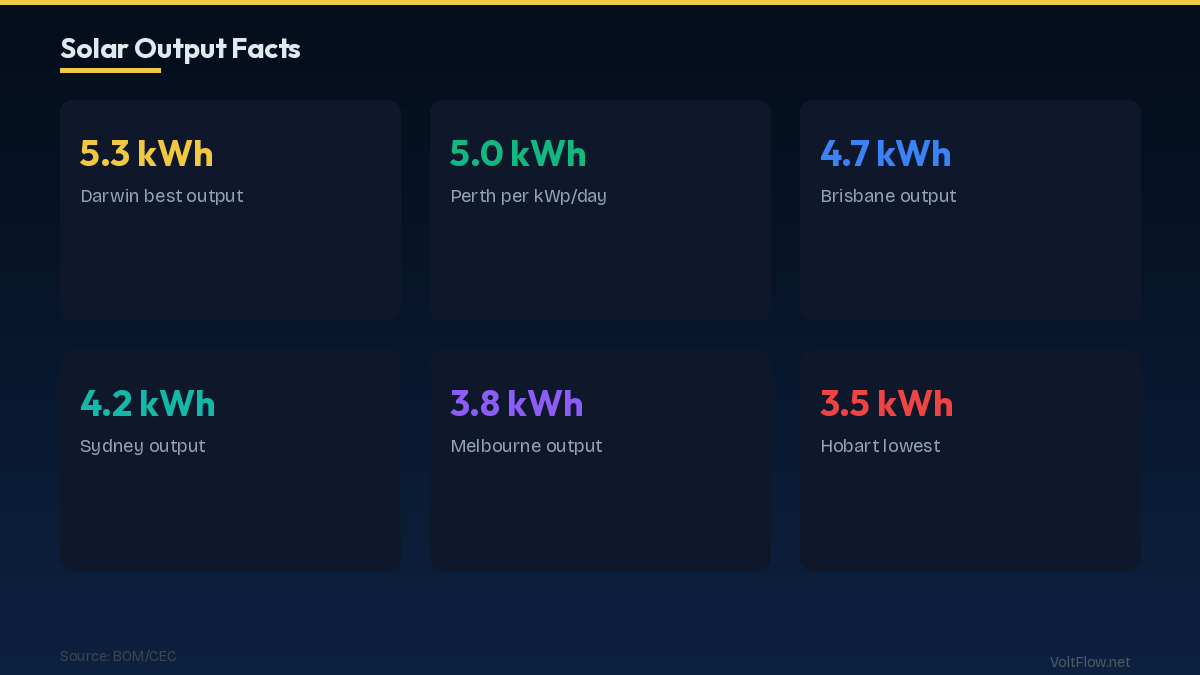
Solar output in Australia ranges from 3.5 to 5.5 kWh per kWp per day. Darwin leads at 5.3 kWh, Perth at 5.0, while Hobart trails at 3.5. A 6.6kW system in Sydney produces 10,100 kWh/year — enough to offset A$2,800+ in electricity.
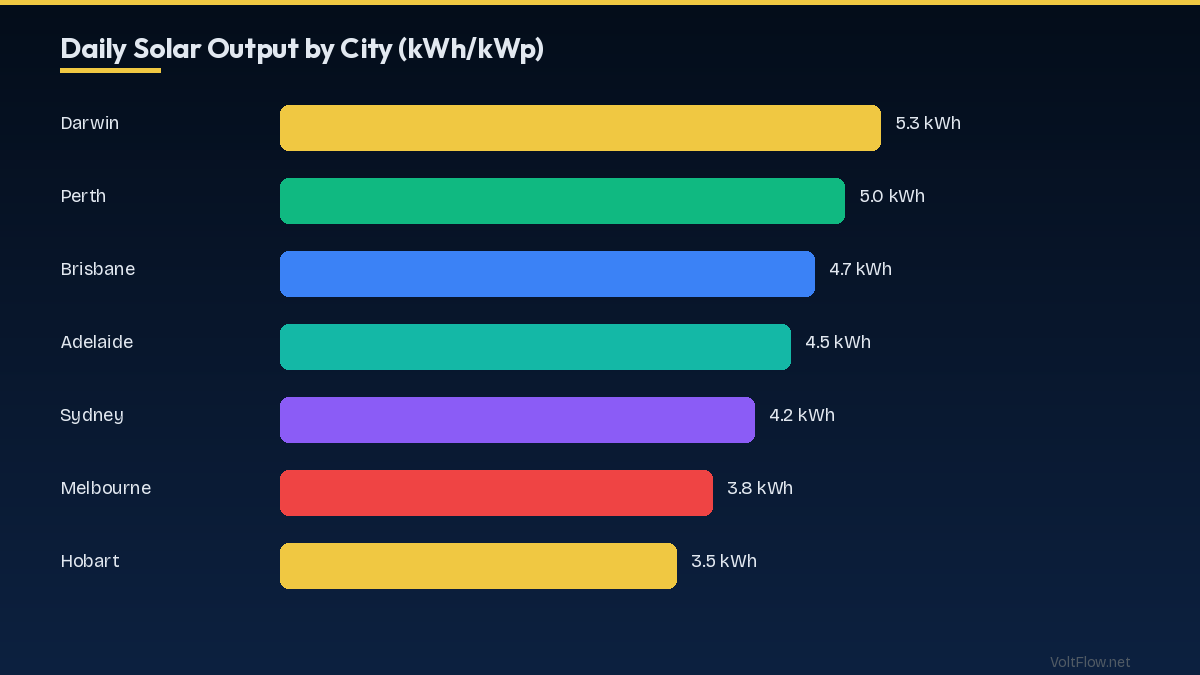
Solar Output by Major City
Solar output varies based on latitude, cloud cover, and seasonal daylight hours. Here's the daily average per kWp installed: Darwin: 5.3 kWh/kWp/day (1,934 kWh/year) — Australia's best solar resource. High year-round irradiance but monsoon season (Nov-Mar) reduces output by 20-30%. A 6.6kW system produces ~12,760 kWh/year. Perth: 5.0 kWh/day (1,825 kWh/year) — excellent year-round solar with dry summers. Perth's Mediterranean climate delivers very consistent output October through April. A 6.6kW system produces ~12,045 kWh/year. Brisbane: 4.7 kWh/day (1,716 kWh/year) — strong solar resource, slightly reduced by summer humidity and storms. A 6.6kW system produces ~11,326 kWh/year. Adelaide: 4.5 kWh/day (1,643 kWh/year) — good output with hot, dry summers. High solar penetration in SA (40%+ of homes). A 6.6kW system produces ~10,844 kWh/year. Sydney: 4.2 kWh/day (1,533 kWh/year) — moderate to good solar. Coastal cloud can reduce summer output. A 6.6kW system produces ~10,118 kWh/year. Canberra: 4.3 kWh/day (1,570 kWh/year) — clear skies but cold winters reduce efficiency slightly. Very good for a southern city. Melbourne: 3.8 kWh/day (1,387 kWh/year) — significant seasonal variation (6:1 summer vs winter ratio). A 6.6kW system produces ~9,154 kWh/year. Hobart: 3.5 kWh/day (1,278 kWh/year) — lowest mainland capital output due to high latitude and cloud cover. Still produces valuable energy over 25+ years.
Seasonal Variation: Summer vs Winter
Seasonal variation increases with latitude. Darwin: Very consistent — summer 5.8 kWh/day, winter 4.8 kWh/day (ratio 1.2:1). Almost no seasonal adjustment needed. Brisbane: Summer 6.0 kWh/day, winter 3.5 kWh/day (ratio 1.7:1). Good year-round performance. Sydney: Summer 5.8 kWh/day, winter 2.8 kWh/day (ratio 2.1:1). Noticeable winter dip but still productive. Melbourne: Summer 6.2 kWh/day, winter 1.8 kWh/day (ratio 3.4:1). Dramatic seasonal swing — size your system for annual average, not winter. Hobart: Summer 5.5 kWh/day, winter 1.5 kWh/day (ratio 3.7:1). Longest nights and most cloud in winter. Implications for battery sizing: In Melbourne and Hobart, you'll import more grid electricity in winter regardless of solar system size. A battery optimized for summer surplus won't have much to store in June-July. Consider TOU tariff optimization as the primary winter strategy.
Panel Orientation and Tilt Angle by Location
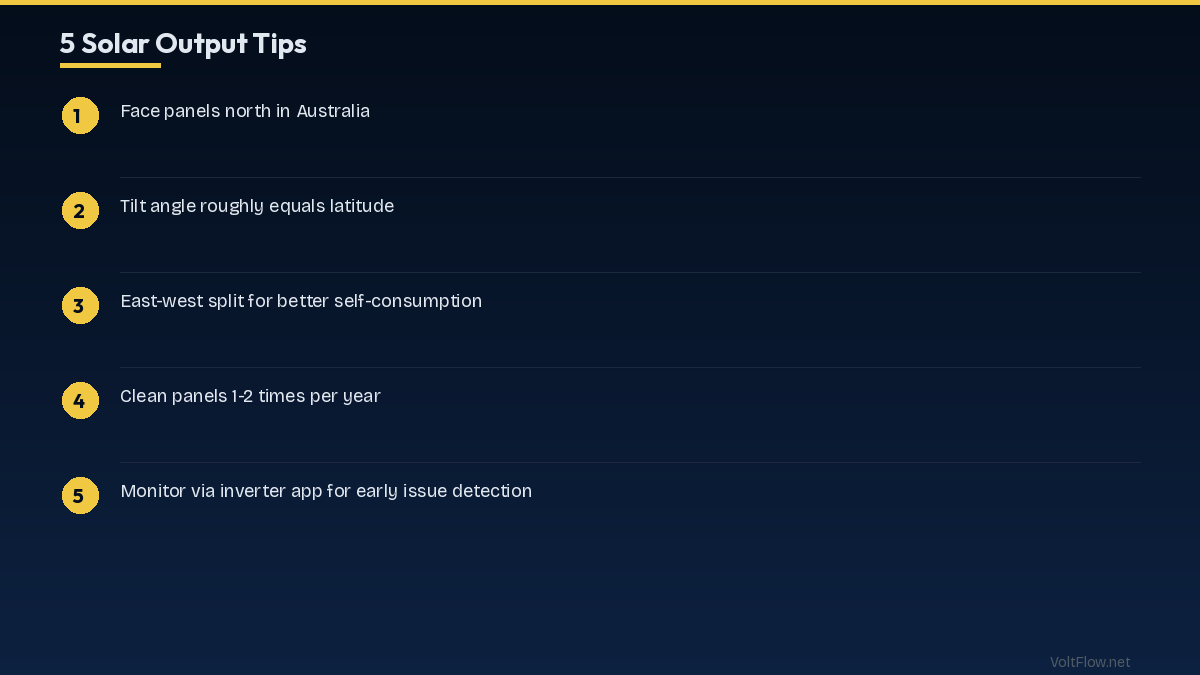
In Australia (Southern Hemisphere), panels should face north for maximum annual output. Optimal tilt angles: Darwin: 12-15° (nearly flat due to equatorial proximity). Brisbane: 25-27°. Sydney: 30-34°. Melbourne: 35-38°. Hobart: 38-42°. East-West split arrays are increasingly popular — mounting panels on both east and west roof faces provides a wider generation curve (more morning and afternoon production) with lower midday peak. This is better for self-consumption but produces 10-15% less total annual energy than optimal north-facing. Flat roof mounting: Tilt frames can be angled optimally, but check DNSP rules — some require setbacks from roof edges for wind safety. On flat roofs in Darwin and Brisbane, even 5-10° tilt is sufficient. Shading considerations: Shading from trees, neighbouring buildings, or roof features (chimneys, satellite dishes, aerials) can reduce output by 10-40%. Even partial shading on one panel affects the entire string — use microinverters or DC optimizers if shading is unavoidable. Get a professional shading analysis (using tools like SunEye or Nearmap) before installation.
How System Size Affects Annual Output
Scaling up your system size proportionally increases output. Here's annual production by system size for Sydney (4.2 kWh/kWp/day): 3kW: ~4,600 kWh/year — minimal system, covers small apartment or low-usage household. 5kW: ~7,665 kWh/year — common entry-level residential system. 6.6kW: ~10,118 kWh/year — most popular size, maximizes 5kW inverter with overclocked panels. 10kW: ~15,330 kWh/year — large household, covers high consumption including pool pump and AC. 13.2kW: ~20,235 kWh/year — maximum single-phase system, may require DNSP approval. For Brisbane, multiply Sydney figures by 1.12. For Melbourne, multiply by 0.90. For Perth, multiply by 1.19. Important: The 6.6kW system with 5kW inverter is the sweet spot because most feed-in tariff agreements and DNSP connections are based on inverter capacity (5kW), not panel capacity. By over-panelling, you get more energy during morning, afternoon, and cloudy periods when panels don't reach peak output — effectively squeezing 10-15% more usable energy from the same inverter.
Degradation and Long-Term Output
Solar panels degrade at approximately 0.4-0.6% per year. Most manufacturers guarantee 80-84% of rated output at year 25. Year 1: 100% output. Year 10: ~95% output. Year 15: ~92% output. Year 25: ~85% output. For a 6.6kW system in Sydney producing 10,118 kWh in year 1: Year 10 output ~9,612 kWh. Year 25 output ~8,600 kWh. Still producing meaningful energy and savings. Real-world factors affecting output: Soiling (dust, bird droppings, pollen) reduces output by 2-5% — clean panels 1-2 times per year or rely on rain in wetter climates. Hot temperatures reduce panel efficiency by 0.3-0.4% per degree above 25°C — counterintuitively, Perth's heat slightly reduces efficiency despite excellent irradiance. Inverter efficiency losses: 2-5%. Wiring losses: 1-3%. System monitoring is essential — platforms like Fronius Solar.web, Enphase Enlighten, and Huawei FusionSolar let you track daily, monthly, and annual production against expected output and catch underperformance early.
Frequently Asked Questions
How much solar power does a 6.6kW system produce in Sydney?
A 6.6kW system in Sydney produces approximately 10,100 kWh/year or 27.7 kWh/day on average. Summer production is about 38 kWh/day, winter about 18 kWh/day.
Which Australian city has the best solar output?
Darwin has the highest average solar output at 5.3 kWh/kWp/day, followed by Perth (5.0) and Brisbane (4.7). Southern cities like Melbourne and Hobart get 3.5-3.8 kWh.
Do solar panels work in Melbourne winter?
Yes, but at reduced output. Melbourne winter production is about 1.8 kWh/kWp/day — roughly 30% of summer output. A 6.6kW system still produces 12 kWh/day in winter.
What angle should solar panels face in Australia?
Panels should face north in Australia. Optimal tilt equals roughly your latitude: Sydney 30-34°, Melbourne 35-38°, Brisbane 25-27°. East-west splits work well for self-consumption.
How much do solar panels degrade over time?
Panels degrade 0.4-0.6% per year. At year 25, expect about 85% of original output. A system producing 10,000 kWh in year 1 will still produce about 8,500 kWh at year 25.