How Much Does Electricity Cost in the US in 2026? State-by-State Guide
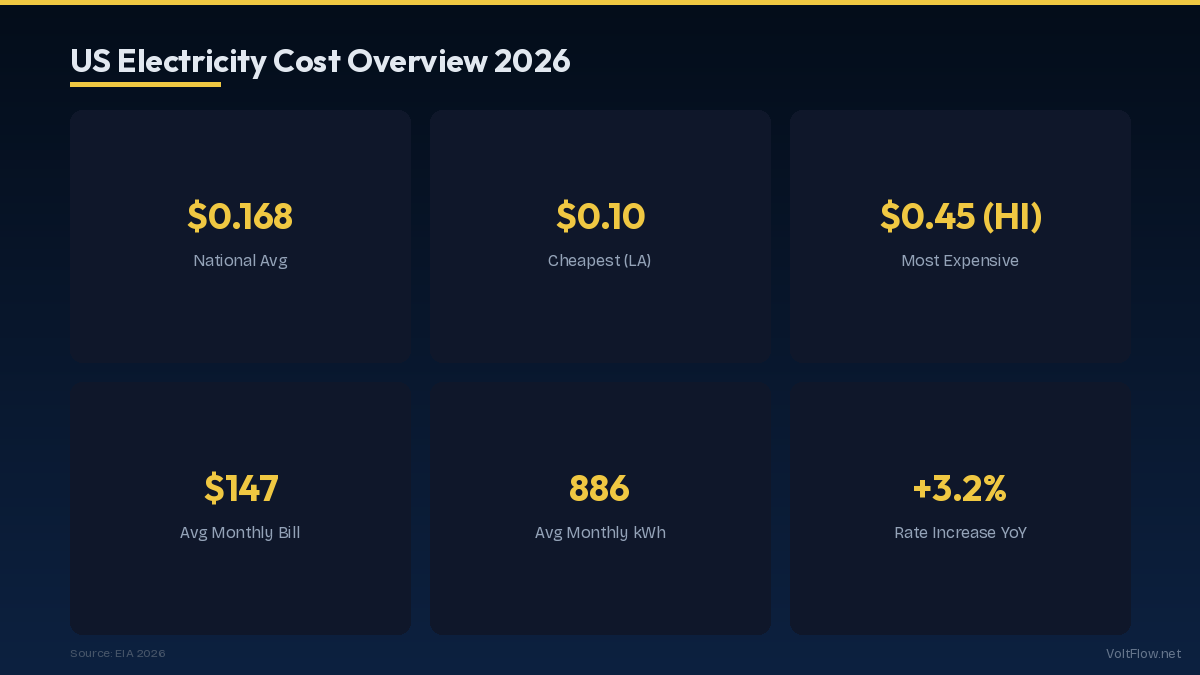
The average residential electricity rate in the United States in 2026 is approximately $0.16 per kWh, but the actual rate you pay varies enormously by state, ranging from $0.10/kWh in Louisiana to $0.40+/kWh in Hawaii. Understanding your electricity cost is essential for calculating savings on solar panels, EV charging, appliance upgrades, and every other energy-related decision. This guide provides a complete state-by-state breakdown with the factors driving price differences.
2026 National Average and How It Has Changed
The national average residential electricity rate in 2026 sits at approximately $0.164 per kWh according to the U.S. Energy Information Administration. This represents a cumulative increase of roughly 25 percent over the past decade, averaging about 2.3 percent annual growth. However, the rate of increase has varied significantly by year and region. The period from 2021 to 2023 saw accelerated rate increases of 4-8 percent per year driven by rising natural gas prices, supply chain disruptions affecting utility equipment, increased grid hardening investments in response to extreme weather events, and the transition costs associated with retiring coal plants and building renewable capacity. Rates stabilized somewhat in 2024-2025 as natural gas prices moderated, but continued infrastructure investment and demand growth from EV charging and data centers have prevented any decline. The national average masks enormous regional variation. New England states pay 60-80 percent above the national average while states in the Mountain West and Southeast pay 20-35 percent below average. Even within a single state, rates vary between utilities. In Texas, customers in the deregulated market might pay anywhere from $0.10 to $0.25 per kWh depending on their chosen retail electricity plan, while customers in areas served by regulated cooperatives pay fixed rates set by the utility commission. Your actual electricity cost may differ from the listed rate because of rate structures that include multiple components. A typical residential bill includes an energy charge per kWh, a delivery or distribution charge per kWh, a customer charge or basic service fee of $5-$15 per month regardless of usage, and various taxes, riders, and surcharges. The all-in rate that matters for savings calculations is your total bill divided by total kWh consumed, which is typically 10-20 percent higher than the listed per-kWh energy charge alone. When calculating potential savings from solar panels, EV charging, or efficiency upgrades, always use your all-in rate from actual bills rather than the utility listed energy rate to get accurate savings projections.
Cheapest States for Electricity in 2026
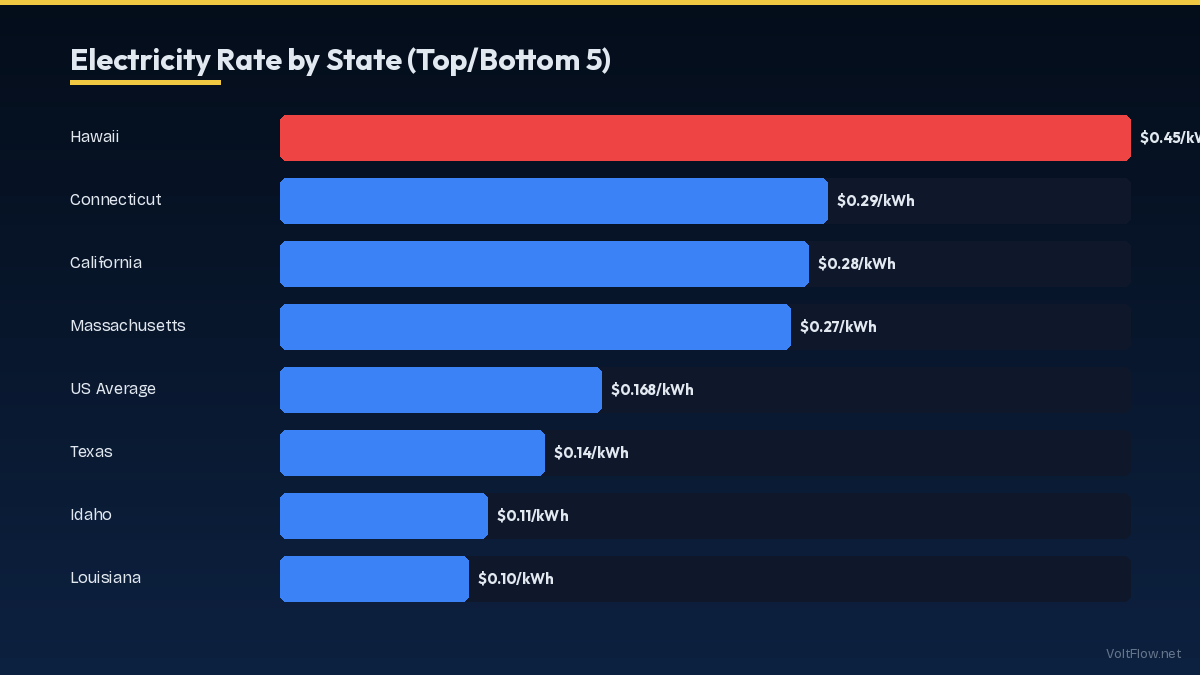
Several states consistently offer electricity rates well below the national average, driven by abundant local energy resources, lower transmission costs, and regulatory environments that keep rates competitive. Louisiana leads the nation among the cheapest states at approximately $0.10 per kWh. The state abundant natural gas production keeps fuel costs for power generation low, and the state regulated utility model limits the rate increases that deregulated markets sometimes experience. Louisiana homeowners using 1,000 kWh per month pay roughly $100, compared to the national average of $164. Oklahoma follows closely at $0.11 per kWh, also benefiting from abundant natural gas and wind energy resources. The state rapidly growing wind farm capacity provides cheap renewable power that blends with gas generation to keep overall rates low. Oklahoma wind energy grew from less than 10 percent of generation a decade ago to approximately 40 percent today, creating a structural cost advantage. Idaho matches at $0.11 per kWh, powered primarily by hydroelectric generation from the Snake River system. Hydropower is the cheapest form of electricity generation, and Idaho access to abundant hydro resources gives it consistently among the lowest rates in the nation. Washington state at $0.12 per kWh benefits from the same Pacific Northwest hydropower system, with the Bonneville Power Administration managing the Columbia River dams that provide cheap wholesale power to the region utilities. Arkansas and Kentucky round out the cheapest tier at $0.12 per kWh, both benefiting from coal and natural gas generation with low fuel costs and relatively low transmission infrastructure expenses due to population density. For homeowners in these cheap-electricity states, the financial case for solar panels is weaker because the savings per kWh are lower. However, EV ownership is extremely attractive because the fueling cost per mile drops to just 2-3 cents, far below even the cheapest gasoline. Energy-intensive activities like pool pumps, electric heating, and cryptocurrency mining are proportionally cheaper, making these states attractive for energy-intensive lifestyles.
Most Expensive States for Electricity in 2026
At the other end of the spectrum, several states pay double or triple the national average for electricity due to imported fuel costs, high infrastructure investment, island geography, or policy-driven rate structures. Hawaii tops the chart at approximately $0.40-$0.43 per kWh, the highest rate in the nation by a wide margin. Hawaii historically relied on imported petroleum for most of its electricity generation, and even as the state rapidly transitions to solar and wind, the legacy infrastructure costs and island grid challenges keep rates extremely high. Hawaiian homeowners using 500 kWh per month pay $200-$215, motivating one of the highest per-capita rooftop solar adoption rates in the country. California rates average $0.28-$0.30 per kWh, driven by a combination of ambitious renewable energy mandates, wildfire mitigation infrastructure spending, high labor costs, and complex regulatory requirements. Pacific Gas and Electric customers in Northern California face even higher rates exceeding $0.35 per kWh during peak hours on time-of-use plans. Despite the high rates, California strong solar resources and generous state incentives make solar payback periods among the shortest at 5-6 years. Connecticut at $0.26-$0.28 per kWh and Massachusetts at $0.27-$0.29 per kWh lead New England with high rates driven by limited local generation, dependence on natural gas delivered through constrained pipeline capacity, and cold winters that drive gas demand for both heating and electricity generation simultaneously. New Hampshire, Rhode Island, and Vermont pay similarly high rates for the same regional reasons. New York averages $0.22-$0.24 per kWh, with New York City metro area customers paying $0.25-$0.30 per kWh through Con Edison. The states aggressive clean energy investments, urban grid infrastructure costs, and high property and labor costs contribute to above-average rates. Alaska at $0.22-$0.25 per kWh faces unique challenges including extreme cold that increases generation fuel consumption, long distances between generation and load centers, and isolated grid systems in rural areas that cannot share power with neighboring utilities. Some rural Alaskan communities pay $0.50-$0.80 per kWh for diesel-generated electricity, the highest local rates in the nation. For homeowners in expensive-electricity states, every energy efficiency investment delivers magnified returns. Solar panels, heat pump water heaters, LED lighting, and EV charging all save two to three times more per year than the same upgrades in cheap-electricity states.
What Makes Electricity Expensive: The Five Cost Components
Understanding the components of your electricity cost explains why rates differ so dramatically between states and helps you identify which components you can influence through efficiency and solar investments. Generation cost represents 50-60 percent of your total bill and covers the fuel and operation of power plants that produce electricity. States with cheap local fuel like hydropower in the Pacific Northwest, natural gas in Louisiana and Oklahoma, or wind in Kansas and Iowa have lower generation costs. States that import fuel or rely on more expensive generation sources pay more. The generation component is the portion most directly offset by rooftop solar panels, which displace the need to purchase generated electricity from the utility. Transmission and distribution cost represents 25-35 percent of your bill and covers the poles, wires, transformers, and substations that deliver electricity from power plants to your home. These costs are relatively fixed regardless of how much electricity you consume, which is why utilities increasingly implement fixed monthly charges that do not decrease even if you install solar. States with dense urban populations typically have lower per-customer transmission costs than rural states where long distribution lines serve fewer customers. Taxes and government surcharges account for 5-10 percent of the bill and vary by state and local jurisdiction. Some states impose renewable energy surcharges to fund clean energy programs. Others include low-income assistance charges, energy efficiency program fees, or state utility taxes. These charges are typically not offset by solar or efficiency measures. Policy and regulatory costs have become an increasingly significant component. Wildfire liability mitigation in California adds billions to utility costs that are passed to ratepayers. Grid modernization investments required by state regulators, renewable portfolio standard compliance costs, and decommissioning costs for retired power plants all flow through to customer rates. These policy-driven costs explain why some states with similar fuel costs have very different retail rates. Demand charges and rate structures affect commercial customers significantly and are beginning to appear in residential bills in some jurisdictions. Demand charges are based on your peak instantaneous usage rather than total consumption, and they penalize homes with high simultaneous draws like EV charging while the AC runs. Solar panels alone do not offset demand charges unless paired with battery storage that limits peak draws from the grid.
How to Find and Reduce Your Actual Electricity Cost
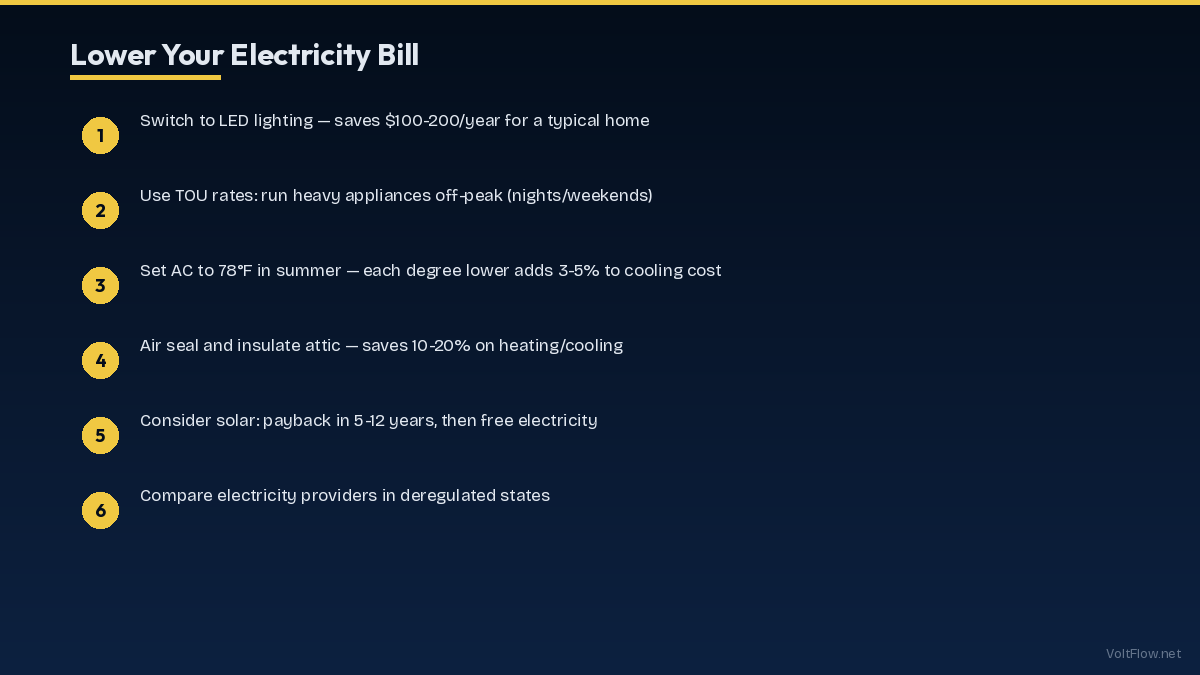
Your actual electricity cost may be higher or lower than your state average depending on your utility, rate plan, usage level, and time of use. Here is how to determine your real rate and reduce it. Start by finding your all-in electricity rate. Pull your most recent electric bill and divide the total charges excluding any unrelated services like gas or water by the total kWh consumed. This gives your effective per-kWh rate including all delivery charges, taxes, and fees. Most customers find their all-in rate is $0.02-$0.05 higher than the listed energy rate. Compare your current rate plan against other available options. In deregulated states like Texas, Ohio, Pennsylvania, and parts of New York, you can choose your electricity supplier and rate plan. Shopping on comparison sites like PowerToChoose in Texas or PA PowerSwitch in Pennsylvania can save $0.02-$0.05 per kWh by switching suppliers, translating to $20-$50 per month in savings for the average household with zero effort beyond a phone call or online enrollment. In regulated states where you cannot choose your supplier, check if your utility offers alternative rate structures. Time-of-use plans save 15-30 percent for households that can shift usage to off-peak hours. Tiered rate plans may benefit low-usage households. EV-specific rate plans offer discounted overnight charging. Budget billing provides predictable monthly payments based on your annual average. Reduce your total consumption to lower your bill regardless of rate. The highest-impact residential efficiency measures in descending order of typical savings are: sealing air leaks and adding insulation which saves $200-$600 per year, upgrading to a heat pump for heating and cooling which saves $500-$1,500 per year, switching to a heat pump water heater which saves $200-$400 per year, converting all lighting to LED which saves $200-$400 per year, upgrading to Energy Star appliances which saves $100-$200 per year, and using smart thermostats and power strips to reduce standby consumption which saves $50-$150 per year. Solar panels reduce your effective electricity rate to near zero for the portion of consumption they offset. At an all-in rate of $0.18 per kWh, an 8 kW solar system producing 10,000 kWh per year saves $1,800 annually. After the 30 percent federal tax credit, the system pays for itself in 6-8 years and then provides essentially free electricity for another 17-22 years.
Electricity Rate Trends and Future Projections
Electricity rates in the US have historically increased at 1.5-3 percent per year, and several factors suggest this trend will continue or accelerate through the end of the decade. Understanding these trends helps with long-term financial planning for solar, efficiency investments, and overall energy budgeting. Grid modernization spending is accelerating as utilities replace aging infrastructure built in the mid-twentieth century. Transmission lines, transformers, and substations have typical lifespans of 40-60 years, and a large portion of the US grid is reaching or exceeding that age. The American Society of Civil Engineers gives the US energy infrastructure a grade of C-minus, indicating significant investment needs. This replacement cycle will add to rates for decades. Extreme weather adaptation is driving billions in new spending. After catastrophic grid failures during events like the 2021 Texas freeze, the 2022 derecho storms, and increasing wildfire risk in the West, utilities are investing in grid hardening, undergrounding power lines, vegetation management, and resilience measures. These costs flow directly to ratepayers. Florida utilities alone have invested over $10 billion in storm hardening since 2000, adding measurably to customer rates. Renewable energy transition creates short-term costs with long-term benefits. Building new wind and solar farms requires upfront capital investment that utilities recover through rates. However, once built, renewable generation has near-zero fuel costs, which eventually lowers the generation component of customer bills. States that are further along in the transition, like Iowa where wind provides over 60 percent of electricity, are beginning to see the fuel cost benefits that offset the capital recovery charges. Electrification of transportation and buildings will increase total electricity demand by 20-40 percent over the next decade as millions of EVs and heat pumps replace gasoline and natural gas. This increased demand supports grid investments by spreading fixed costs across more kWh, potentially moderating per-kWh rate increases. However, the grid must be expanded to handle the higher peak loads, which requires investment that may temporarily outpace the benefits of higher volume. Data center growth driven by artificial intelligence and cloud computing is adding significant new electrical load in concentrated areas, sometimes straining local grid capacity and driving infrastructure upgrades that affect nearby residential rates. The most actionable takeaway from these trends is that electricity rates will almost certainly be higher in 10 years than they are today. Every efficiency investment and solar installation you make now locks in savings at today lower rates while the value of those savings grows as rates increase. A solar system that saves $1,500 per year today might save $2,000-$2,500 per year in 2035 if rates increase by 2.5 percent annually, without any change in your consumption or the system output.