Solar Panel Cost Per Watt by State 2026: Complete Price Comparison
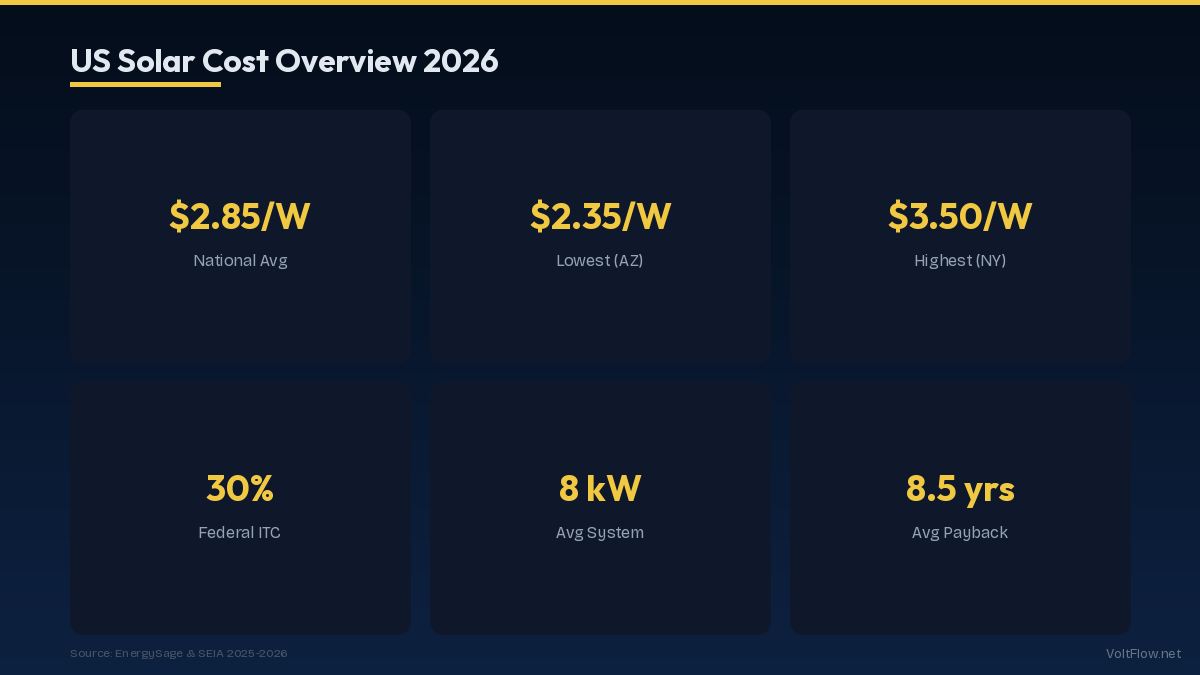
The cost of solar panels in the United States varies significantly from state to state, ranging from $2.25 per watt in sunny, competitive markets like Arizona and Texas to $3.50+ per watt in states with less solar infrastructure like Alaska and North Dakota. In 2026, the national average sits at approximately $2.75 per watt before the 30% federal tax credit, bringing the effective cost down to about $1.93 per watt. This guide breaks down solar costs state by state, explains what drives the price differences, and helps you calculate your actual out-of-pocket cost after incentives.
National Average Solar Cost in 2026
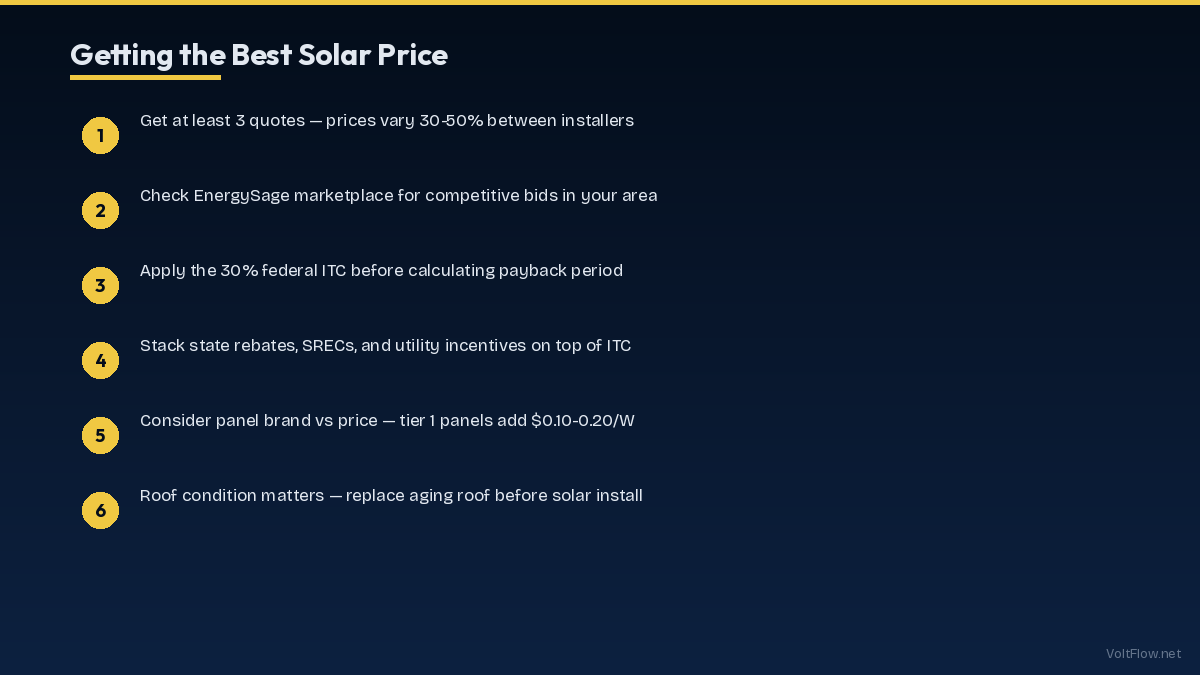
The cost of residential solar has dropped dramatically over the past decade but has stabilized in recent years as equipment costs plateaued and labor costs increased. In 2026, the national average for a fully installed residential solar system is $2.75 per watt before incentives. For a typical 8 kW system that covers the electricity needs of an average American home, that translates to a gross cost of $22,000. After the 30-percent federal Investment Tax Credit, which remains in effect through 2032 under the Inflation Reduction Act, the net cost drops to $15,400. The cost per watt metric is the standard way the solar industry prices systems because it allows apples-to-apples comparisons regardless of system size. A $2.75-per-watt quote for a 6 kW system ($16,500 gross) is directly comparable to the same rate on a 10 kW system ($27,500 gross). What the cost per watt includes varies by installer, so always ask for an itemized breakdown. A complete installed cost should cover the solar panels themselves (typically 30-35 percent of total cost), the inverter or microinverters (10-15 percent), mounting hardware and racking (5-8 percent), electrical components like disconnects, conduit, and monitoring equipment (5-8 percent), labor for installation (15-25 percent), permitting and interconnection fees (3-5 percent), and company overhead, warranty, and profit margin (15-25 percent). If a quote seems significantly below market at $1.50-$2.00 per watt, scrutinize what is included. Some low-ball quotes exclude permitting, electrical upgrades, or roof reinforcement that you will need to pay for separately. Others use lower-quality panels with shorter warranties or less efficient output that reduces your long-term savings. The best approach is to get three to five quotes from local installers and at least one from a national company, then compare the cost per watt alongside equipment specifications, warranty terms, and company reviews. The cheapest per-watt price is not always the best value if it comes with inferior equipment or a company that might not be around to honor the warranty in ten years.
Cheapest States for Solar Installation
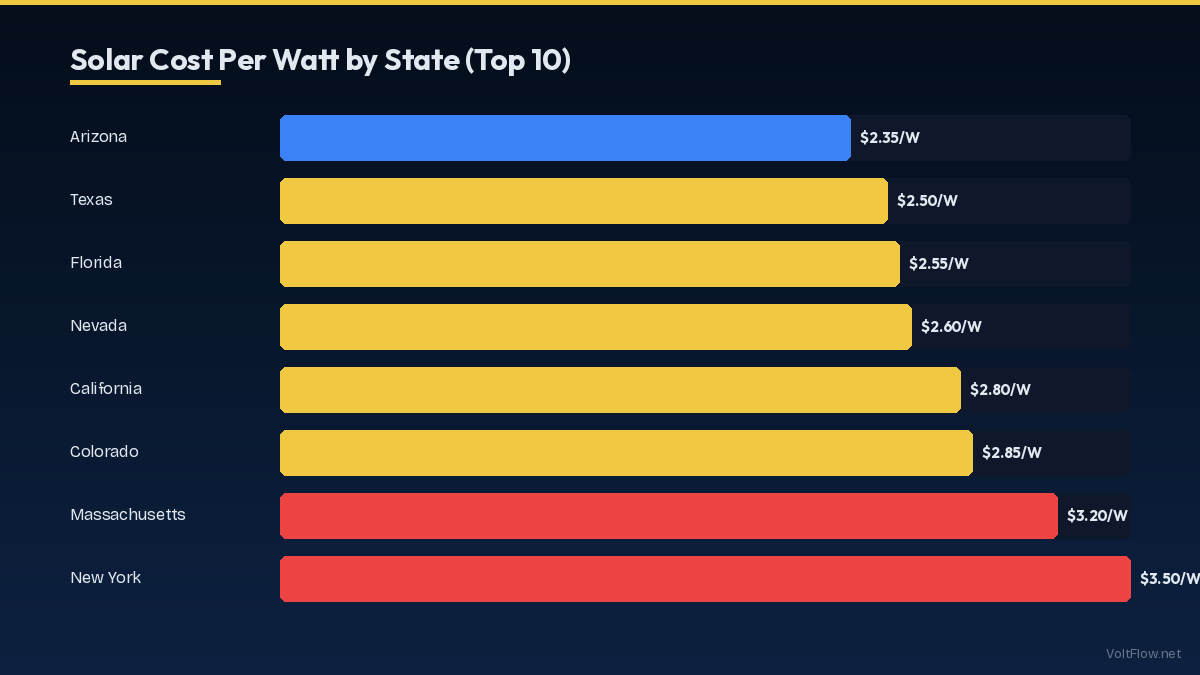
Several factors combine to make solar significantly cheaper in certain states: abundant sunshine driving demand and competition, favorable regulations that streamline permitting, strong installer competition, and state-level financial incentives that stack on top of the federal credit. Arizona consistently ranks among the cheapest states for solar at $2.20-$2.50 per watt. The state receives over 300 days of sunshine annually, creating massive demand that supports a large installer workforce and competitive pricing. Arizona also has no state sales tax on solar equipment purchases, saving homeowners an additional 5-6 percent. Texas has emerged as a solar powerhouse with costs averaging $2.25-$2.55 per watt. The deregulated electricity market in much of Texas means homeowners face variable and sometimes very high electricity rates, making solar savings more compelling and driving demand. Texas also has no state income tax, which simplifies the incentive picture, and many utility companies offer net metering or buyback programs. Florida matches or undercuts many other sunny states at $2.30-$2.60 per watt. The state exempted solar equipment from property tax assessments, meaning your home value increases from solar but your property taxes do not. Florida also waived sales tax on solar purchases. However, Florida does not have mandatory net metering statewide, which affects long-term savings depending on your utility. California was once the most expensive solar market but increasing competition has driven costs down to $2.50-$2.80 per watt. While still above the cheapest states, California offers the highest electricity rates in the continental US, making the payback period among the shortest at just five to seven years. California also has the Self-Generation Incentive Program for battery storage that can add another $200-$400 per kWh in rebates on paired battery systems. Nevada, Colorado, New Mexico, and North Carolina round out the cheapest tier at $2.40-$2.65 per watt. Each combines reasonable sunshine, active installer markets, and supportive state policies. Colorado offers a state tax credit on top of the federal credit, while North Carolina benefits from a large and competitive installer base driven by favorable utility interconnection rules.
Most Expensive States and Why
At the other end of the spectrum, several states see solar costs well above the national average due to limited sunshine, harsh weather requiring specialized equipment, thin installer competition, and complex permitting processes. Alaska leads with costs ranging from $3.25 to $4.00 per watt. Extreme weather conditions require specialized mounting systems rated for heavy snow loads, and the limited sunshine window of 3-5 peak sun hours even in Anchorage during summer makes solar less economically attractive, resulting in fewer installers and less competition. Despite the high cost per watt, Alaska homeowners with electricity rates exceeding $0.25-$0.40 per kWh can still achieve reasonable payback periods. North Dakota and South Dakota see costs of $3.00-$3.50 per watt, driven primarily by thin installer competition in sparsely populated areas. Travel time between installation sites adds to labor costs, and harsh winters require cold-weather-rated equipment. These states also lack state-level solar incentives beyond the federal credit. The Northeast corridor presents a mixed picture. States like Connecticut, Massachusetts, and New York have costs of $2.80-$3.20 per watt, which is above average, but they also have the highest electricity rates in the country at $0.25-$0.35 per kWh. When you combine high electricity costs with generous state incentives like the Massachusetts SMART program, New York MegaWatt Block program, and Connecticut RSIP program, the effective payback period can actually be shorter than in cheaper solar states with lower electricity rates. The lesson is that cost per watt alone does not determine solar economics. A system costing $3.00 per watt in Massachusetts that offsets $0.30-per-kWh electricity and receives $2,000-$4,000 in state rebates can pay for itself in six years, while a $2.40-per-watt system in a state with $0.10-per-kWh electricity and no state incentives might take twelve to fifteen years to break even. Always calculate your specific payback period using local electricity rates, all available incentives, and your actual energy consumption before making a decision based on cost per watt alone.
State-by-State Solar Cost Table and Incentives
Here is a comprehensive overview of residential solar costs and key incentives across all 50 states as of early 2026. The cost per watt figures represent average fully installed prices before any incentives. Alabama averages $2.70, no state credit. Alaska averages $3.50, no state credit but high utility rates offset cost. Arizona averages $2.35, no state income tax benefit but sales tax exempt. Arkansas averages $2.80, no state credit. California averages $2.65, SGIP battery rebate available. Colorado averages $2.50, state tax credit of $1,000-$2,000. Connecticut averages $3.00, RSIP rebate program. Delaware averages $2.90, Green Energy Fund grants. Florida averages $2.45, sales and property tax exempt. Georgia averages $2.60, no state credit. Hawaii averages $2.85, high electricity rates make payback fast. Idaho averages $2.75, state tax deduction. Illinois averages $2.70, SREC market adds income. Indiana averages $2.75, no state credit. Iowa averages $2.80, state tax credit 50 percent of federal. Kansas averages $2.85, property tax exempt. Kentucky averages $2.90, no state credit. Louisiana averages $2.60, no state credit. Maine averages $2.95, strong net metering. Maryland averages $2.80, SREC market strong. Massachusetts averages $3.00, SMART incentive program. Michigan averages $2.85, no state credit. Minnesota averages $2.90, Made in Minnesota incentive. Mississippi averages $2.75, no state credit. Missouri averages $2.70, property tax exempt. Montana averages $2.85, no state credit. Nebraska averages $2.90, no state credit. Nevada averages $2.45, net metering at retail rate. New Hampshire averages $3.00, state rebate $1,000. New Jersey averages $2.85, strong SREC market. New Mexico averages $2.50, state tax credit 10 percent. New York averages $3.10, MegaWatt Block incentive. North Carolina averages $2.55, strong utility programs. North Dakota averages $3.25, no state credit. Ohio averages $2.75, SREC market. Oklahoma averages $2.65, no state credit. Oregon averages $2.80, state tax credit. Pennsylvania averages $2.80, SREC market. Rhode Island averages $3.05, REF incentive. South Carolina averages $2.65, state tax credit 25 percent. South Dakota averages $3.15, no state credit. Tennessee averages $2.70, TVA Green Invest. Texas averages $2.40, no state tax. Utah averages $2.55, state tax credit. Vermont averages $3.00, net metering strong. Virginia averages $2.75, no state credit. Washington averages $2.85, sales tax exempt. West Virginia averages $2.90, no state credit. Wisconsin averages $2.80, Focus on Energy rebate. Wyoming averages $3.00, net metering. These figures change quarterly as markets evolve, so get multiple current quotes from local installers for the most accurate pricing.
How to Calculate Your Actual Solar Cost
Understanding your true out-of-pocket cost requires working through a simple calculation that accounts for system size, local pricing, and all available incentives. Start by determining your system size. Pull your last twelve months of electricity bills and add up total kilowatt-hours consumed. Divide that annual total by your location peak sun hours times 365 to get the system size in kilowatts. For example, if you use 10,000 kWh per year and live in a location with 5 peak sun hours per day, you need 10,000 divided by (5 times 365) equals 5.48 kW, which you would round up to a 6 kW system. Next, multiply your system size by the local cost per watt to get the gross installed cost. A 6 kW system at $2.75 per watt costs $16,500 before incentives. Apply the 30-percent federal Investment Tax Credit, which reduces the cost by $4,950, bringing it to $11,550. Then apply any state-level incentives. If your state offers a $2,000 rebate or tax credit, your net cost drops to $9,550. Some states also exempt solar from sales tax and property tax, which does not reduce your upfront cost but eliminates ongoing tax increases from the added home value. Calculate your annual savings by multiplying your electricity rate by the expected annual production. A 6 kW system in a location with 5 peak sun hours produces approximately 8,000-9,000 kWh per year (accounting for system losses). At $0.16 per kWh, that saves $1,280-$1,440 per year. Divide your net cost by annual savings to get the simple payback period: $9,550 divided by $1,360 equals approximately seven years. After the payback period, every dollar of electricity your panels produce is pure savings. With solar panels warranted for 25-30 years, that means 18-23 years of free electricity. Factor in electricity rate increases averaging 2-3 percent per year, and lifetime savings on a 6 kW system typically reach $30,000-$50,000 depending on your local rates and rate escalation. Financing options affect your actual cash flow even if the total cost is higher due to interest. Solar loans at 4-7 percent interest rates result in monthly payments that are often lower than the electricity bill savings from day one, creating an immediate positive cash flow. Leases and power purchase agreements eliminate upfront costs entirely but capture 20-40 percent of the total savings for the leasing company.
Factors That Drive Solar Cost Differences Between States
Understanding why solar costs vary by up to 60 percent between the cheapest and most expensive states helps you evaluate quotes and negotiate better pricing. The single biggest factor is installer competition. States with more solar installations per capita have more installers competing for business, driving prices down. California, Texas, Florida, and Arizona each have thousands of active solar companies, while states like North Dakota, Alaska, and West Virginia may have fewer than a dozen. More competition means more aggressive pricing, better customer service, and faster installation timelines. Labor costs vary significantly across the country and typically represent 15-25 percent of total system cost. An installer in Mississippi paying electricians $25-$35 per hour faces fundamentally different economics than one in Connecticut paying $45-$65 per hour. States with higher costs of living consistently see higher solar installation prices, partially offset by higher electricity rates that improve payback calculations. Permitting and interconnection processes create hidden costs that vary dramatically. Some states and municipalities have adopted standardized solar permits that cost $100-$200 and take two to three days to approve. Others require engineered drawings, structural certifications, multiple inspections, and utility interconnection studies that add $500-$2,000 and four to eight weeks of delay. These soft costs get passed through to the homeowner in higher cost-per-watt quotes. Equipment choices also drive regional cost differences. Installers in high-wind or heavy-snow regions specify premium mounting systems and reinforced racking that cost 20-40 percent more than standard equipment. Coastal installations require corrosion-resistant hardware. Ground-mount systems in states where roof mounting is impractical due to orientation or shading add $0.20-$0.50 per watt compared to roof-mount installations. Market maturity plays a role as well. In established solar markets, installers have refined their processes, have relationships with permitting offices, and can install systems more quickly. A crew that installs 15-20 systems per month operates more efficiently than one doing 3-5 systems per month, and those efficiency gains translate to lower per-watt costs. When evaluating quotes, ask each installer what specific factors are driving their pricing. A transparent installer can explain exactly where every dollar goes and help you understand whether a higher quote reflects better equipment, more thorough installation practices, or simply higher margins. The lowest price is not always the best value, but understanding the cost drivers helps you distinguish genuine quality premiums from inflated pricing.